Backtesting
Use daily position signals with finlab.backtest.sim to quickly backtest and generate stock selection lists with risk/return analysis.
Quick Start
The following example uses "price < 6" as a condition, rebalancing monthly:

Let AI help you write strategies
Want to try more strategies but unsure about the syntax? After installing FinLab Skill, the AI coding assistant can help you write entry/exit conditions, choose rebalancing frequency, and set stop-loss/take-profit.
After uploading the backtest to the cloud, you can view holdings and changes in the "Stock Selection List" and manually follow the trades.

Display Backtest Results
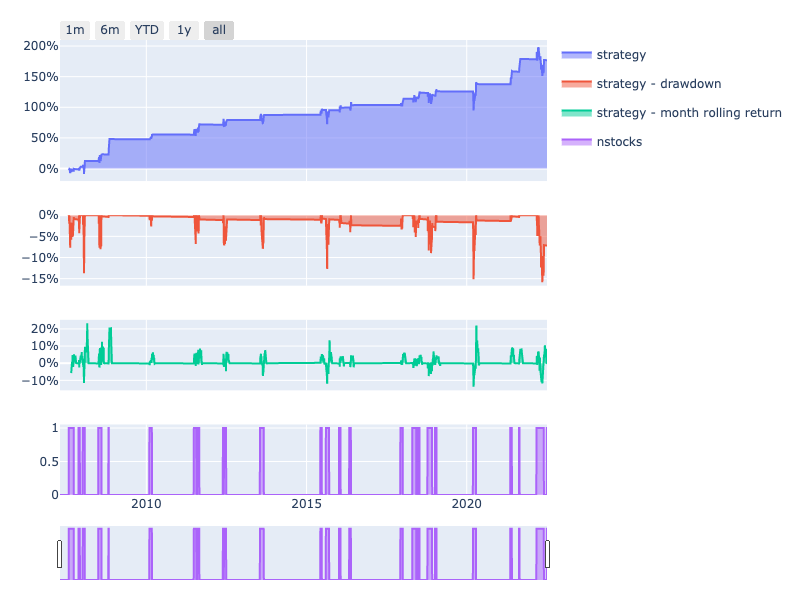
Get Trade Records
Key Trade Record Fields
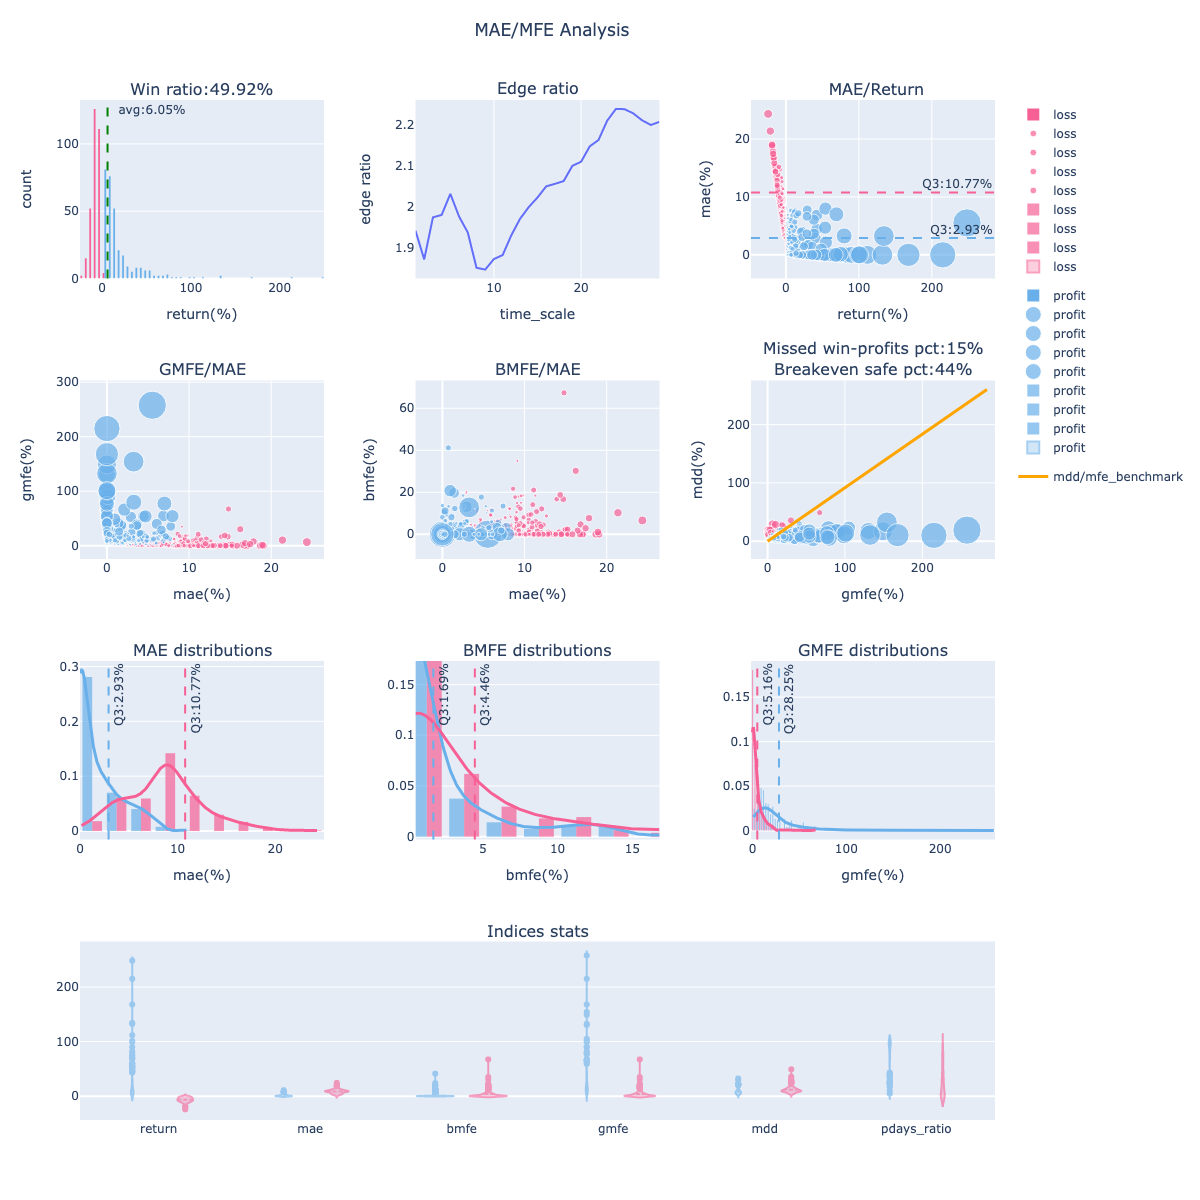
* exit_sig_date: Date the exit signal was generated. * entry_sig_date: Date the entry signal was generated. * entry_date: Entry date. * exit_date: Exit date. * period: Holding period in days. * position: Position weight. * return: Return rate. * mdd: Maximum drawdown during the holding period. * mae: Maximum adverse excursion during the holding period. * g_mfe: Maximum favorable excursion during the holding period. * b_mfe: Maximum favorable excursion before MAE occurred.Display Volatility Analysis Chart
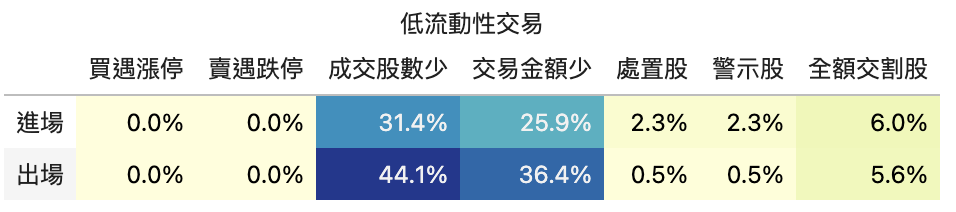
Strategy Liquidity Risk Assessment
from finlab.analysis.liquidityAnalysis import LiquidityAnalysis

# Percentage of trades with volume > 100,000 shares and turnover > 1,000,000, to assess position capacity
report.run_analysis(LiquidityAnalysis(required_volume=100000, required_turnover=1000000))
More Examples
New High Strategy
Identify new highs using a 250-day high:
from finlab import data
from finlab.backtest import sim

# Stocks reaching a 250-day high
close = data.get('price:收盤價')
position = (close == close.rolling(250).max())

# Backtest, rebalance monthly (M)
sim(position, resample='M', name="New Year-High Strategy")

High RSI Technical Indicator Strategy
Select the top 20 stocks by RSI and hold for one week:
from finlab import data
from finlab.backtest import sim

# Select the 20 stocks with the highest RSI
rsi = data.indicator('RSI')
position = rsi.is_largest(20)

# Backtest, rebalance weekly (W)
report = sim(position, resample='W', name="High RSI Strategy")

Price Deviation + Financial Statement Filter
Select the top 30 by 60-day price deviation, filtered by ROE > 0:
from finlab import data
from finlab.backtest import sim

# Download ROE and closing prices
roe = data.get("fundamental_features:ROE稅後")
close = data.get('price:收盤價')

position = (
      (close / close.shift(60)).is_largest(30) # Top 30 by price deviation
    & (roe > 0) # ROE greater than 0
)

# Backtest, rebalance monthly (M)
report = sim(position, resample='M', name="Deviation + ROE Filter Strategy")

Common Errors and Solutions
Error 1: Strategy Has No Trade Records
Symptom: Backtest completes but there are no trades; get_trades() returns an empty DataFrame
close = data.get('price:收盤價')
position = (close > 100) & (close < 110)  # Conditions too strict
report = sim(position, resample='M')

trades = report.get_trades()
print(len(trades))  # 0
Causes:
- Entry conditions are too strict, causing position to be almost all False
- Date range is too short, with insufficient trading days to trigger entry
- Stock pool after filtering is too small or empty
Solution:
from finlab import data
from finlab.backtest import sim

close = data.get('price:收盤價')
position = (close > 100) & (close < 110)

# Check entry signal statistics
entry_stats = position.sum(axis=1)  # Number of entry stocks per day
print("=== Entry Signal Statistics ===")
print(f"Average daily entry stocks: {entry_stats.mean():.2f}")
print(f"Maximum entry stocks: {entry_stats.max()}")
print(f"Minimum entry stocks: {entry_stats.min()}")
print(f"Trading days with entry signals: {(entry_stats > 0).sum()} / {len(entry_stats)}")

# If average entries < 1, conditions are too strict
if entry_stats.mean() < 1:
    print("\nWarning: Entry conditions are too strict, less than 1 stock per day on average")
    print("Suggestions:")
    print("1. Widen the price range (e.g., 80-120)")
    print("2. Use .is_largest(N) to ensure a fixed number of stocks")
    print("3. Check data completeness (is data.get() working properly?)")

    # Fix example: Use is_largest() to ensure a fixed number
    ma20 = close.average(20)
    position_fixed = (close > ma20).is_largest(30)  # Fixed selection of 30 stocks
    print("\nUsing fixed-count strategy:")
    print(f"   Average daily entry stocks: {position_fixed.sum(axis=1).mean():.2f}")

# Run backtest and check results
report = sim(position, resample='M', name="Test Strategy")
trades = report.get_trades()

if len(trades) == 0:
    print("\nError: Strategy has no trade records")
    print("Check the entry signal statistics above to verify if conditions are too strict")
else:
    print(f"\nBacktest successful, {len(trades)} trades")
    print(f"   Period: {trades['entry_date'].min()} ~ {trades['exit_date'].max()}")
Advanced Diagnostics:
# Check position status at specific time points
import pandas as pd

# Sample 10 trading days
sample_dates = position.index[::len(position)//10][:10]
for date in sample_dates:
    stocks = position.loc[date][position.loc[date]].index.tolist()
    print(f"{date}: {len(stocks)} stocks - {stocks[:5]}...")

# Check if any stocks never entered
never_entered = (position.sum(axis=0) == 0)
print(f"\nStocks that never entered: {never_entered.sum()} / {len(position.columns)}")
Error 2: KeyError - Date Index Error
Symptom: KeyError thrown during backtesting with a date that does not exist
Causes:
- Date index ranges are inconsistent when using multiple data sources
- position date range exceeds the available data range
- Using shift() or rolling() causes missing data in early periods
Solution:
from finlab import data
from finlab.backtest import sim
import finlab

# Method 1: Use truncate_start to align the start date
finlab.truncate_start = '2020-01-01'  # Only backtest data after 2020

close = data.get('price:收盤價')
volume = data.get('price:成交股數')

# Check date ranges
print(f"Closing price date range: {close.index[0]} ~ {close.index[-1]}")
print(f"Volume date range: {volume.index[0]} ~ {volume.index[-1]}")

# Method 2: Manually align date indices
common_dates = close.index.intersection(volume.index)
close_aligned = close.loc[common_dates]
volume_aligned = volume.loc[common_dates]

print(f"Aligned date range: {common_dates[0]} ~ {common_dates[-1]}")

# Method 3: Use try-except to catch errors
try:
    position = (close > close.average(20)) & (volume > 1000)
    report = sim(position, resample='M')
    print("Backtest successful")

except KeyError as e:
    print(f"Date index error: {e}")
    print("\nPossible causes:")
    print("1. Using rolling() or average() causes missing early-period data")
    print("2. Date ranges are inconsistent across multiple data sources")
    print("\nSolutions:")
    print("1. Set finlab.truncate_start to unify start date")
    print("2. Use .dropna() to remove missing values")

    # Auto-fix: remove missing values
    position_cleaned = position.dropna(how='all', axis=0)  # Remove all-NaN rows
    position_cleaned = position_cleaned.fillna(False)       # Fill NaN with False

    print(f"\nMissing values removed, re-running backtest...")
    report = sim(position_cleaned, resample='M')
    print(f"   Backtest period: {position_cleaned.index[0]} ~ {position_cleaned.index[-1]}")
Advanced Diagnostics: Check position completeness
import pandas as pd

# Check missing values in position
missing_info = position.isna()
print("=== Position Missing Value Statistics ===")
print(f"Total missing values: {missing_info.sum().sum()}")
print(f"All-NaN rows (dates): {missing_info.all(axis=1).sum()}")
print(f"All-NaN columns (stocks): {missing_info.all(axis=0).sum()}")

# Show first few dates with missing values
missing_dates = missing_info.any(axis=1)
if missing_dates.sum() > 0:
    print(f"\nFirst 5 dates with missing values:")
    for date in position.index[missing_dates][:5]:
        na_count = position.loc[date].isna().sum()
        print(f"  {date}: {na_count} stocks missing")
Error 3: Forgetting to Set resample Results in Daily Rebalancing
Symptom: Backtest returns are very low with an abnormally high number of trades
report = sim(position)  # Missing resample parameter
trades = report.get_trades()
print(len(trades))  # Thousands of trades
Causes:
- resample parameter is not set, defaulting to daily rebalancing
- Daily rebalancing generates excessive trading costs (commissions + transaction tax)
- Most strategies should not rebalance daily
Solution:
from finlab import data
from finlab.backtest import sim

close = data.get('price:收盤價')
position = close > close.average(20)

# Wrong: no resample set (daily rebalancing)
report_daily = sim(position, name="Daily Rebalancing")
trades_daily = report_daily.get_trades()

# Correct: set a reasonable rebalancing frequency
report_monthly = sim(position, resample='M', name="Monthly Rebalancing")
trades_monthly = report_monthly.get_trades()

# Compare trade counts and performance
print("=== Rebalancing Frequency Comparison ===")
print(f"Daily rebalancing: {len(trades_daily)} trades, annualized return {report_daily.stats['annual_return']:.2%}")
print(f"Monthly rebalancing: {len(trades_monthly)} trades, annualized return {report_monthly.stats['annual_return']:.2%}")

# Monthly rebalancing typically outperforms daily (lower transaction costs)
if report_monthly.stats['annual_return'] > report_daily.stats['annual_return']:
    print("\nRecommendation: Use 'Monthly Rebalancing' to significantly reduce trading costs")
Common rebalancing frequencies:
# Weekly strategy (suitable for short-term)
report = sim(position, resample='W', name="Weekly Rebalancing")

# Monthly strategy (most common, suitable for part-time traders)
report = sim(position, resample='M', name="Monthly Rebalancing")

# Quarterly strategy (suitable for long-term)
report = sim(position, resample='Q', name="Quarterly Rebalancing")

# Custom rebalancing frequency (e.g., every 20 trading days)
report = sim(position, resample='20D', name="Every 20 Days Rebalancing")
Reference Resources
- API Reference - backtest - Complete sim() parameter documentation
- Strategy Optimization Guide - Find optimal rebalancing frequency and stop-loss/take-profit parameters
- Complete Strategy Development Workflow - From research to live trading
- Risk Management Guide - Stop-loss/take-profit practical techniques
- FAQ - More troubleshooting